:format(webp)/cdn.vox-cdn.com/uploads/chorus_image/image/27630377/20130820_lbm_sv7_099.0.jpg)
Introduction
This is the third and final time I will look at historical walk and strikeout rates for prospects. If you followed my previous installments, much of this will look familiar to you; however, these results are more complex and different. For those who are new, the basic premise is this: how likely is it that an offensive prospect succeeds in the major leagues based only on his minor league walk and strikeout rates?
Previous Installments
Success rates
Rookie | Short-A | Single-A | Advanced-A | Double-A | Triple-A
Correlation posts
Rookie and Short-A | Single-A | Advanced-A | Double-A | Triple-A
Method
First, I compiled the minor league numbers for all Baseball America top 100 offensive prospects from 1990 to 2007. I stopped at 2007 to allow enough time for the player to achieve MLB success. I only included top 100 prospects to add in a form of scouting to the picture. Stats and scouting should work hand-in-hand and an analysis similar to this can help augment a scout’s evaluation of talent.
 Must Reads
Next, I compared each prospect’s walk and strikeout rate to the league average that year, creating BB+ and K+ metrics. Finally, I compared the walk and strikeout rates at various ages and levels of prospects in the minor leagues to their career MLB FanGraphs Batting runs. Batting runs are calculated using wOBA linear weights and adjusting for park effects. Basically this gives us the total runs above average that the player produced on offense, after adjusting for park.
In order to put players into the low, average, and high categories for BBs and Ks, I use a 15% variation from 100 BB+ or K+. This means that 85-115 marks average for each, while players below 85 are "Low" and players above 115 are "High." Since this analysis relies on bins, I allow for a 5% variation on the cutoffs. For instance, if a player has an 83 BB+ (78-88), I look at the historical percentages for both low and average walk rates.
Prospects are required to have 500 career minor league PAs to qualify in this analysis.
The following table is an estimate of where these cutoffs actually lie in terms of BB% and K% values.
| BB% | K% | |
|---|---|---|
| Low | 7.7% | 15.4% |
| High | 10.5% | 20.8% |
A player with at least 0.01 batting runs per plate appearance in 1500 career plate appearances is tagged "Productive," while players with negative batting runs or fewer than 1500 career PAs are "Busts." It is important to note that I am only interested in hitting ability. This is how Edgar Renteria ends up in the "Bust" category. He had a great career, accumulating 35.7 fWAR; however, his batting was worth -52.3 runs.
Results
Here are the historical results for prospects over their career, split by BB% and K%.
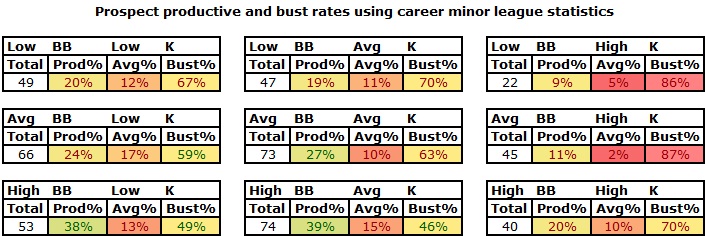
Over a player's entire minor league career, the best approach involves high walk and low strikeout rates. However, a lot of both or not many of either are kind of okay too. Where a player really gets in trouble is when he starts striking out without the ability to take a walk. Then he turns into a one true outcome player, where that outcome is not getting on base. That will never be the new market inefficiency.
Prospects in 2013
How do the 2013 preseason consensus top 190 prospects and select draft picks that qualify stack up in this analysis?
| Name | Team | Rank | BB+ | SO+ | Prod% | Avg% | Bust% |
| Wil Myers | Rays | 4 | 139 | 108 | 39% | 15% | 46% |
| Corey Seager | Dodgers | 96 | 122 | 99 | 39% | 15% | 46% |
| Joc Pederson | Dodgers | 121 | 134 | 95 | 39% | 15% | 46% |
| Michael Taylor | Nationals | 6th | 124 | 91 | 39% | 15% | 46% |
| Rio Ruiz | Astros | 4th | 121 | 102 | 39% | 15% | 46% |
| Byron Buxton | Twins | 17 | 142 | 98 | 39% | 15% | 46% |
| Aaron Hicks | Twins | 62 | 167 | 105 | 39% | 15% | 46% |
| Delino Deshields Jr. | Astros | 88 | 126 | 103 | 39% | 15% | 46% |
| Dan Vogelbach | Cubs | 129 | 143 | 81 | 39% | 14% | 48% |
| Brad Miller | Mariners | 136 | 129 | 83 | 39% | 14% | 48% |
| Marcus Semien | White Sox | 6th | 145 | 89 | 39% | 14% | 48% |
| Jackie Bradley | Red Sox | 34 | 152 | 89 | 39% | 14% | 48% |
| Jesse Winker | Reds | 180 | 154 | 84 | 39% | 14% | 48% |
| Garin Cecchini | Red Sox | 133 | 161 | 82 | 39% | 14% | 48% |
| Chris Taylor | Mariners | 5th | 146 | 85 | 39% | 14% | 48% |
| Deven Marrero | Red Sox | 1st | 132 | 85 | 39% | 14% | 48% |
| Max Muncy | Athletics | 5th | 164 | 79 | 38% | 13% | 49% |
| Jurickson Profar | Rangers | 1 | 133 | 71 | 38% | 13% | 49% |
| Tommy La Stella | Braves | 8th | 127 | 45 | 38% | 13% | 49% |
| Jeimer Candelario | Cubs | 165 | 138 | 80 | 38% | 13% | 49% |
| Mookie Betts | Red Sox | 5th | 152 | 53 | 38% | 13% | 49% |
| Kelvin Encarnacion | Cubs | Int. | 159 | 76 | 38% | 13% | 49% |
| Francisco Lindor | Indians | 16 | 120 | 63 | 38% | 13% | 49% |
| Jace Peterson | Padres | 1st | 140 | 66 | 38% | 13% | 49% |
| Billy Burns | Nationals | 32nd | 147 | 64 | 38% | 13% | 49% |
| Kyle Parker | Rockies | 152 | 116 | 109 | 33% | 13% | 55% |
| Darin Ruf | Phillies | 20th | 114 | 100 | 33% | 13% | 55% |
| Xander Bogaerts | Red Sox | 9 | 113 | 103 | 33% | 13% | 55% |
| Tyler Austin | Yankees | 82 | 117 | 106 | 33% | 13% | 55% |
| Christian Yelich | Marlins | 11 | 117 | 104 | 33% | 13% | 55% |
| Nick Franklin | Mariners | 55 | 111 | 98 | 33% | 13% | 55% |
| Rosell Herrera | Rockies | Int. | 110 | 97 | 33% | 13% | 55% |
| Max Kepler | Twins | 142 | 114 | 89 | 32% | 14% | 54% |
| Hak-Ju Lee | Rays | 76 | 111 | 88 | 32% | 14% | 54% |
| Josmil Pinto | Twins | Int. | 113 | 80 | 31% | 15% | 54% |
| Matt Skole | Nationals | 188 | 192 | 113 | 30% | 13% | 58% |
| Michael Choice | Athletics | 111 | 123 | 117 | 30% | 13% | 58% |
| Gregory Bird | Yankees | 5th | 205 | 117 | 30% | 13% | 58% |
| Addison Russell | Athletics | 33 | 126 | 116 | 30% | 13% | 58% |
| Jonathan Singleton | Astros | 29 | 168 | 114 | 30% | 13% | 58% |
| Brian Goodwin | Nationals | 58 | 147 | 111 | 30% | 13% | 58% |
| Michael Ohlman | Orioles | 11th | 134 | 111 | 30% | 13% | 58% |
| Mac Williamson | Giants | 3rd | 90 | 107 | 27% | 10% | 63% |
| Jedd Gyorko | Padres | 49 | 108 | 90 | 27% | 10% | 63% |
| Oswaldo Arcia | Twins | 61 | 91 | 99 | 27% | 10% | 63% |
| Josh Bell | Pirates | 123 | 105 | 97 | 27% | 10% | 63% |
| Nick Castellanos | Tigers | 25 | 90 | 104 | 27% | 10% | 63% |
| Carlos Correa | Astros | 22 | 106 | 94 | 27% | 10% | 63% |
| Drew Vettleson | Rays | 166 | 100 | 94 | 27% | 10% | 63% |
| Cheslor Cuthbert | Royals | 169 | 96 | 90 | 27% | 10% | 63% |
| Reymond Fuentes | Padres | 1st | 98 | 105 | 27% | 10% | 63% |
| Roman Quinn | Phillies | 164 | 103 | 105 | 27% | 10% | 63% |
| Billy Hamilton | Reds | 23 | 109 | 102 | 27% | 10% | 63% |
| Jonathan Schoop | Orioles | 93 | 95 | 82 | 26% | 14% | 61% |
| Alen Hanson | Pirates | 52 | 99 | 89 | 26% | 14% | 61% |
| Jacob Realmuto | Marlins | 146 | 93 | 85 | 26% | 14% | 61% |
| Blake Swihart | Red Sox | 140 | 95 | 84 | 26% | 14% | 61% |
| Travis Jankowski | Padres | 1st | 93 | 88 | 26% | 14% | 61% |
| Devon Travis | Tigers | 13th | 102 | 55 | 24% | 17% | 59% |
| J.R. Murphy | Yankees | 2nd | 99 | 79 | 24% | 17% | 59% |
| Kevin Plawecki | Mets | 1st | 99 | 51 | 24% | 17% | 59% |
| Gregory Polanco | Pirates | 54 | 100 | 78 | 24% | 17% | 59% |
| Kolten Wong | Cardinals | 65 | 92 | 65 | 24% | 17% | 59% |
| Jorge Polanco | Twins | Int. | 98 | 58 | 24% | 17% | 59% |
| Carlos Rodriguez | Orioles | Int. | 105 | 28 | 24% | 17% | 59% |
| Travis D'Arnaud | Mets | 12 | 87 | 91 | 23% | 11% | 67% |
| Joey Terdoslavich | Braves | 6th | 86 | 98 | 23% | 11% | 67% |
| Cody Asche | Phillies | 4th | 84 | 95 | 23% | 11% | 67% |
| Jorge Bonifacio | Royals | 172 | 88 | 106 | 23% | 11% | 67% |
| Arismendy Alcantara | Cubs | Int. | 80 | 103 | 23% | 11% | 67% |
| Roman Hernandez | Royals | Int. | 82 | 107 | 23% | 11% | 67% |
| Austin Hedges | Padres | 50 | 88 | 82 | 23% | 13% | 65% |
| Eddie Rosario | Twins | 119 | 85 | 88 | 23% | 13% | 65% |
| Oscar Taveras | Cardinals | 2 | 85 | 67 | 22% | 15% | 63% |
| Stephen Piscotty | Cardinals | 1st | 89 | 51 | 22% | 15% | 63% |
| Raimel Tapia | Rockies | Int. | 83 | 65 | 22% | 15% | 63% |
| Jose Ramirez | Indians | Int. | 82 | 44 | 22% | 15% | 63% |
| Nolan Arenado | Rockies | 53 | 77 | 52 | 20% | 12% | 67% |
| Maikel Franco | Phillies | 141 | 76 | 75 | 20% | 12% | 67% |
| Adonis Garcia | Yankees | Int. | 51 | 67 | 20% | 12% | 67% |
| Wilmer Flores | Mets | 149 | 65 | 66 | 20% | 12% | 67% |
| Taylor Lindsey | Angels | 1st | 69 | 72 | 20% | 12% | 67% |
| Rougned Odor | Rangers | 176 | 64 | 76 | 20% | 12% | 67% |
| Kevin Pillar | Blue Jays | 32nd | 67 | 68 | 20% | 12% | 67% |
| Rob Brantly | Marlins | 181 | 74 | 61 | 20% | 12% | 67% |
| Hector Roa | Astros | Int. | 50 | 78 | 20% | 12% | 67% |
| Mason Williams | Yankees | 40 | 77 | 70 | 20% | 12% | 67% |
| Alex Yarbrough | Angels | 4th | 47 | 74 | 20% | 12% | 67% |
| Christian Bethancourt | Braves | 117 | 50 | 80 | 20% | 12% | 67% |
| Shawon Dunston | Cubs | 11th | 23 | 70 | 20% | 12% | 67% |
| Didi Gregorius | Diamondbacks | 113 | 71 | 63 | 20% | 12% | 67% |
| Luis Hernandez | Diamondbacks | Int. | 63 | 66 | 20% | 12% | 67% |
| Luis Sardinas | Rangers | 114 | 75 | 68 | 20% | 12% | 67% |
| Jose Iglesias | Red Sox | 157 | 69 | 76 | 20% | 12% | 67% |
| Jose Peraza | Braves | Int. | 71 | 59 | 20% | 12% | 67% |
| Joey Gallo | Rangers | 132 | 154 | 176 | 20% | 10% | 70% |
| Miguel Sano | Twins | 15 | 134 | 136 | 20% | 10% | 70% |
| George Springer | Astros | 46 | 141 | 135 | 20% | 10% | 70% |
| Mike Olt | Cubs | 27 | 161 | 134 | 20% | 10% | 70% |
| Bubba Starling | Royals | 56 | 126 | 138 | 20% | 10% | 70% |
| Brett Jackson | Cubs | 155 | 136 | 141 | 20% | 10% | 70% |
| Nomar Mazara | Rangers | Int. | 123 | 137 | 20% | 10% | 70% |
| Matt Adams | Cardinals | 184 | 78 | 87 | 20% | 12% | 69% |
| Stefen Romero | Mariners | 186 | 70 | 83 | 20% | 12% | 69% |
| Brandon Drury | Diamondbacks | 13th | 60 | 83 | 20% | 12% | 69% |
| Dorssys Paulino | Indians | 90 | 71 | 90 | 20% | 12% | 69% |
| Gary Brown | Giants | 103 | 75 | 84 | 20% | 12% | 69% |
| Adeiny Hechavarria | Marlins | 149 | 74 | 85 | 20% | 12% | 69% |
| Carlos Sanchez | White Sox | 127 | 77 | 82 | 20% | 12% | 69% |
| Carlos Tocci | Phillies | Int. | 56 | 86 | 20% | 12% | 69% |
| Randal Grichuk | Angels | 1st | 50 | 99 | 19% | 11% | 70% |
| Chris Owings | Diamondbacks | 120 | 38 | 107 | 19% | 11% | 70% |
| Jake Marisnick | Marlins | 63 | 79 | 98 | 19% | 11% | 70% |
| Avisail Garcia | White Sox | 116 | 47 | 107 | 19% | 11% | 70% |
| Gary Sanchez | Yankees | 35 | 92 | 113 | 19% | 6% | 75% |
| Richie Shaffer | Rays | 184 | 90 | 111 | 19% | 6% | 75% |
| Kaleb Cowart | Angels | 48 | 100 | 111 | 19% | 6% | 75% |
| Edward Salcedo | Braves | 181 | 81 | 114 | 17% | 7% | 77% |
| Aaron Altherr | Phillies | 9th | 80 | 113 | 17% | 7% | 77% |
| Patrick Kivlehan | Mariners | 4th | 82 | 118 | 17% | 7% | 77% |
| Domingo Santana | Astros | Int. | 115 | 155 | 16% | 6% | 79% |
| Trayce Thompson | White Sox | 145 | 114 | 141 | 16% | 6% | 79% |
| Trevor Story | Rockies | 59 | 114 | 134 | 16% | 6% | 79% |
| Patrick Wisdom | Cardinals | 173 | 116 | 124 | 16% | 6% | 79% |
| Slade Heathcott | Yankees | 85 | 110 | 129 | 16% | 6% | 79% |
| D.J. Davis | Blue Jays | 138 | 115 | 142 | 16% | 6% | 79% |
| Elier Hernandez | Royals | Int. | 62 | 112 | 14% | 8% | 78% |
| Mike Zunino | Mariners | 20 | 102 | 121 | 11% | 2% | 87% |
| Lewis Brinson | Rangers | 108 | 102 | 176 | 11% | 2% | 87% |
| Max Stassi | Astros | 4th | 92 | 124 | 11% | 2% | 87% |
| Victor Roache | Brewers | 178 | 101 | 135 | 11% | 2% | 87% |
| Matt Davidson | Diamondbacks | 81 | 108 | 125 | 11% | 2% | 87% |
| Jonathan Villar | Astros | 189 | 103 | 130 | 11% | 2% | 87% |
| Marcell Ozuna | Marlins | 115 | 88 | 121 | 10% | 4% | 87% |
| Robert Hefflinger | Braves | 7th | 88 | 139 | 10% | 4% | 87% |
| Julio Morban | Mariners | Int. | 80 | 136 | 10% | 4% | 87% |
| Yasiel Balaguert | Cubs | Int. | 88 | 135 | 10% | 4% | 87% |
| Javier Baez | Cubs | 18 | 65 | 123 | 9% | 5% | 86% |
| Adam Walker | Twins | 3rd | 71 | 121 | 9% | 5% | 86% |
| Courtney Hawkins | White Sox | 71 | 68 | 164 | 9% | 5% | 86% |
| Jorge Alfaro | Rangers | 104 | 61 | 142 | 9% | 5% | 86% |
| Nick Williams | Rangers | 2nd | 56 | 130 | 9% | 5% | 86% |
| Yorman Rodriguez | Reds | Int. | 76 | 134 | 9% | 5% | 86% |
| Adalberto Mondesi | Royals | 105 | 79 | 122 | 9% | 5% | 86% |
That is quite a few names and I can't cover the placement of all of them. However, a few stick out: George Springer's approach has been the cause of much concern. However, his high walk rate saves him, and this needs to be more widely disseminated. At the bottom of the list are three very interesting prospects: Javier Baez, Jorge Alfaro, and Raul Mondesi. Each are highly regarded and for many a good reason. Their current approach is not one of them, though.
I talked at some length about Baez in the Advanced-A version of this series. He is a unique prospect, possessing ridiculous power potential from the shortstop position. That combination of power and position lead him to kind of "break" this system. However, I am still leery about his inability to take a walk.
Alfaro is a catching prospect and as such, I am willing to cut him some slack, since catchers are a completely different animal offensively. Much less is expected of them and they may mature at a slower rate. Speaking of maturing, Mondesi needs to do much of that, and 2014 will be his age-18 season. His walk rate dropped quite a bit this past year, and he will need to work on that, but he still has plenty of time to do so.
Summary
What did we learn since starting this series four months ago? Extreme rates at lower levels are actually okay. Don't worry about a prospect's high strikeouts and low walks until he gets into the upper levels. Age is a definite determining factor, even among prospects at the same level. Much more is expected from a 22-year old at Double-A than a 21-year old.
As is the traditionally held value, success in Double-A is an extremely important step for a prospect. A player really needs to get through there before his age-22 season, or else he is fighting against history.
It's generally bad for a prospect to not walk a lot, but there are certain ages and strikeout levels where that is not such a terrible sign, particularly if the player also doesn't strike out a lot. High strikeout totals can be perfectly acceptable at lower levels and at upper levels with an equally high amount of walks. A high walk rate is the best determining factor in a player's approach for his chances at becoming a productive hitter.
Conclusion
One main point of contention in this series is that it ignores power. Players who can hit the ball out of the park with regularity have an upper hand, even with a less than desirable approach. Initially, I ignored power because so many variables go into minor league power numbers. However, with the help of the team here at Beyond the Box Score, my next series will go more in-depth on how power develops and how it correlates to major league success.
. . .
Statistics courtesy of Fangraphs and Baseball Prospectus.
Chris St. John is a writer at Beyond The Box Score. You can follow him on Twitter at @stealofhome.