:format(webp)/cdn.vox-cdn.com/uploads/chorus_image/image/28689629/170831302.0.jpg)
On the surface, Matt Cain's 4.00 ERA in 2013 seems like a bad thing. There's also his career high HR/9 of 1.12. Or that career worst RE24 of -3.47 and rWAR 0.5. But I'm here to tell you that it's not as bad as it may seem and there's no reason to think Cain can't be a solid 2-3 starter for the Giants.
A lot of Cain's numbers from last year still seem within his average range throughout his career. BABIP has been steady over the last three seasons, BB/9 hasn't gone over three, and K/9 has been hovering over seven. The only anomaly here is Cain's HR/9, where it was that career high mentioned before.
| Year | K/9 | BB/9 | HR/9 | BABIP |
|---|---|---|---|---|
| 2006 | 8.45 | 4.11 | 0.85 | .263 |
| 2007 | 7.34 | 3.56 | 0.68 | .278 |
| 2008 | 7.69 | 3.76 | 0.79 | .297 |
| 2009 | 7.07 | 3.02 | 0.91 | .263 |
| 2010 | 7.13 | 2.46 | 0.89 | .252 |
| 2011 | 7.27 | 2.56 | 0.37 | .260 |
| 2012 | 7.92 | 2.09 | 0.86 | .259 |
| 2013 | 7.17 | 2.69 | 1.12 | .260 |
 More from our team sites
More from our team sites
Just as is the norm with BABIP, the numbers will regress to the mean. And because a lot of Cain's numbers here, including his 2013 numbers, skew toward his average, I would assume that these stats would remain in a similar territory, barring a completely disastrous season.
There's also the case of his slider. It may not be indicative of anything, but it should still be noted that Cain threw his slider 28.2% of the time in 2013, up from 19.9% in 2012, according to FanGraphs. And PITCHf/x lists his slider as having been thrown for 28.1%, up from 20.3%. The numbers alone don't show that there may be anything to worry about, even despite his fastball being thrown less.
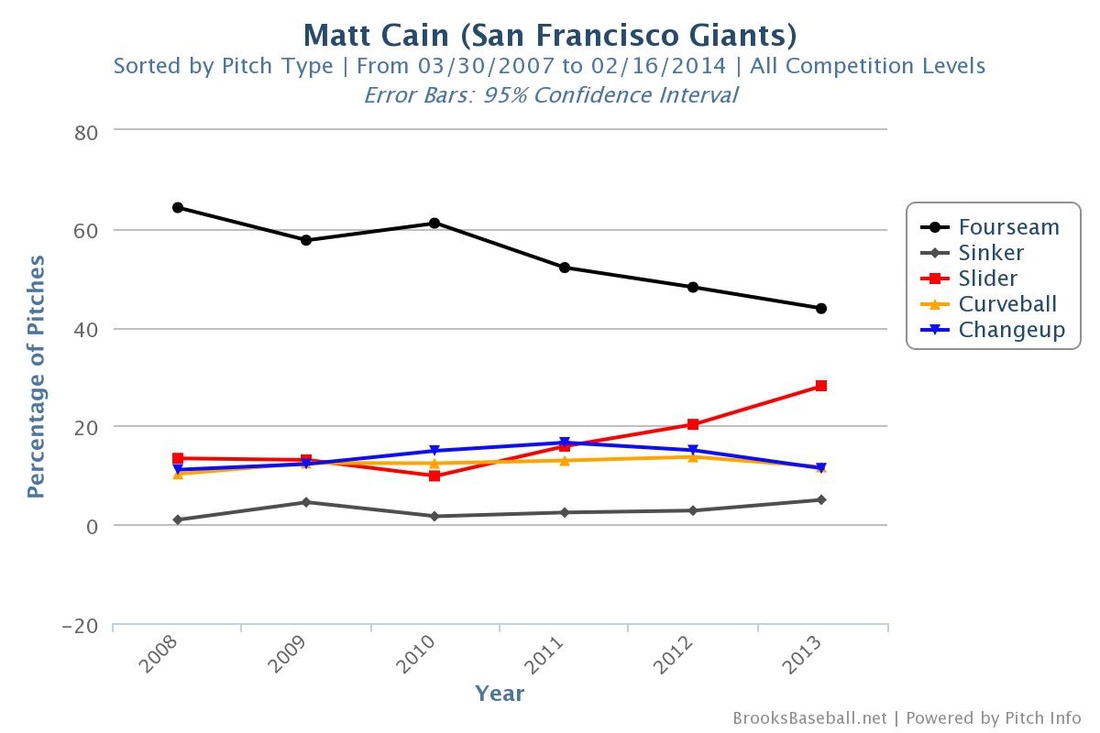 (BrooksBaseball.net)
The percentage of his pitches he uses his fastball has been steadily declining. Cain had spectacular years in 2011 and 2012, so the fact that his fastball percentage was also declining in those years shouldn't be something that is the outlier.
That's not all to Cain's stats, of course. When you look at his ERA, FIP, and xFIP, including the variations of these stats compared to league average, Cain's always been somewhere between average and above average. 2013 was the first season he's had since 2006 (his first full season) that stood out with numbers higher than normal.
| Year | ERA | FIP | xFIP | ERA- | FIP- | xFIP- |
|---|---|---|---|---|---|---|
| 2006 | 4.15 | 3.96 | 4.59 | 92 | 87 | 101 |
| 2007 | 3.65 | 3.78 | 4.47 | 82 | 84 | 99 |
| 2008 | 3.76 | 3.91 | 4.46 | 87 | 90 | 103 |
| 2009 | 2.89 | 3.89 | 4.16 | 70 | 94 | 98 |
| 2010 | 3.14 | 3.65 | 4.00 | 82 | 96 | 100 |
| 2011 | 2.88 | 2.91 | 3.78 | 80 | 80 | 98 |
| 2012 | 2.79 | 3.40 | 3.82 | 75 | 93 | 98 |
| 2013 | 4.00 | 3.93 | 3.88 | 114 | 111 | 103 |
Cain's known amongst Bay Area fans as an underrated pitcher — particularly, someone who can pitch well but doesn't have a lot of wins to show for it (though, of course, pitcher wins and losses are arbitrary and useless). What the numbers show is that he has a tendency to improve on the year before. 2012 was an improvement from 2011 as a whole, 2011 was an improvement on 2010, and so forth. While there was a small spike in ERA and ERA- between 2009 and 2010, it wasn't really anything to worry about.
Yeah, there was an uptick in 2013 where the numbers are concerned. But regressing to the mean is also a thing that happens. With an xFIP- that always stays within the same range, there's no reason to doubt Cain's ability as a starter. I'm disregarding ERA because it's not really a good way to measure how good a pitcher is, especially since FIP was developed to be a better measure than ERA. With the average FIP in 2013 being at around 4.00, Cain's 2013 was simply that: average. For reasons that the numbers may not show completely, he had an off year. If you want to call an average/hovering-below-average year a bad season, Matt Cain isn't doing too bad for himself.
. . .
All statistics and information courtesy of FanGraphs, Baseball Reference, and Brooks Baseball.
Jen Mac Ramos is a contributor for Beyond the Box Score. You can follow her on twitter at @jnmcrms.