
Mapping with d3.js
In the same sense that a line graph is a simple representation of data on a document, a map can be regarded as a set of points with an underlying coordinate system. When you say it like that it seems obvious that it should be applied as a document for display. However, I don't want to give the impression that this is some sort of trivial matter for either the original developers or for you the person who wants to display a map. Behind the scenes for this type of work the thought that must have gone into making the code usable and extensible must have been enormous.
Mike Bostock has lauded the work of Jason Davies in the development of the latest major version of d3.js (version 3) for his work on improving mapping capability. A visit to his home page provides a glimpse into Jason's expertise and no visit would be complete without marveling at his work with geographic projections.
Examples
I am firmly of the belief that mapping in particular has an enormous potential for adding value to data sets. The following collection of examples gives a brief taste of what has been accomplished by combining geographic information and D3 thus far. (the screen shots following have been sourced from the biovisualize gallery and as such provide attribution to the best of my ability. If I have incorrectly attributed the source or author please let me know and I will correct it promptly)
Above is an interactive visualization showing the position of the main map on a faux D3 3d globe with a Mapbox / Open Street Map main window. Source dev.geosprocket.com by Bill Morris.
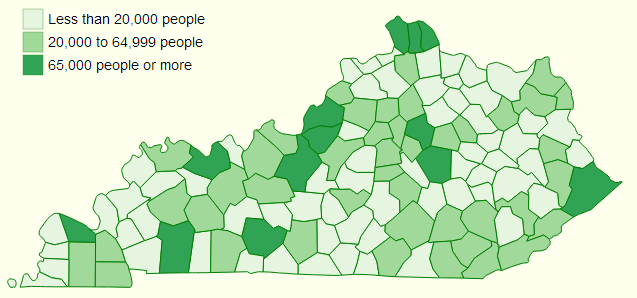
This is a breakdown of population in Kentucky Counties from the 2010 census. Source: ccarpenterg.github.com by Cristian Carpenter.

This map visualizes air pollution in Beijing. Source: scottcheng.github.com by Scott Cheng.

This is a section of the globe that is presented on the Shuttle Radar Topography Mission tile downloading web site. This excellent site uses the interactive globe to make the selection of srtm tiles easy. Source dwtkns.com by Derek Watkins.

This is a static screen-shot of an animated tour of the Worlds countries. Source bl.ocks.org by Mike Bostock.

This is one of the great infographics published by the New York Times. Source: www.nytimes.com by Mike Bostock, Shan Carter and Kevin Quealy.

This is an animated graphic showing a series of concentric circles emanating from glowing red dot which was styled after a news article in The Onion. Source: bl.ocks.org by Mike Bostock.

Here we see earthquakes represented on a selectable timeline where D3 generates a svg overlay and the map layer is created using Leaflet. Source: bl.ocks.org by tnightingale.

Carrying on with the earthquake theme, this is a map of all earthquakes in the past 24 hours over magnitude 2.5. Source: bl.ocks.org by benelsen.

An interactive satellite projection. Source dev.geosprocket.com by Bill Morris.
GeoJSON and TopoJSON
Projecting countries and various geographic features onto a map can be a very data hungry exercise. By that I mean that the information required to present geographic shapes can result in data files that are quite large. GeoJSON has been the default geographic data file of choice for quite some time, and as the name would suggest it encodes the data in a JSON type hierarchy. Often these GeoJSON files include a significant amount of extraneous detail or incorporate a level of accuracy that is impractical (too detailed).Enter TopoJSON. Mike Bostock has designed TopoJSON as an extension to GeoJSON in the sense that it has a similar structure, but the geometries are not encoded discretely and where they share features, they are combined. Additionally TopoJSON encodes numeric values more efficiently and can incorporate a degree of simplification. This simplification can result in savings of file size of 80% or more depending on the area and use of compression. Although TopoJSON has only begun to be used, the advantages of it seem clear and so I will anticipate it's future use by incorporating it in my example diagrams (not that the use of GeoJSON differs much if at all). A great description of TopoJSOn can be found on the TopoJSON wiki on github.
No comments:
Post a Comment