We offer private, customized training for 3 or more people at your site or online.
Downloads Required:
In this tutorial:
Files needed:
- ProductReport1.zip
- ProductReport2.zip
- AWSales.zip
Related tutorials:
For many years, SQL Server did not have a good answer for creating attractive reports that summarize information in ways that make sense to business users. Finally, Microsoft shipped SQL Server Reporting Services. Like Notification Services, Reporting Services was originally an add-on for SQL Server 2000, and now it's a part of the core product. In this chapter, you'll learn how to use Reporting Services to produce your own reports.
SSRS 2008 Tutorial: The Reporting Services Architecture
Reporting Services has a quite a few components that work together seamlessly to provide a complete reporting solution. The full Reporting Services architecture includes development tools, administration tools, and report viewers. There are a number of ways to get to Reporting Services programmatically, including URL, SOAP and WMI interfaces.
Figure 17-1 shows a simplified diagram of the main Reporting Services components that we'll be using in this chapter.
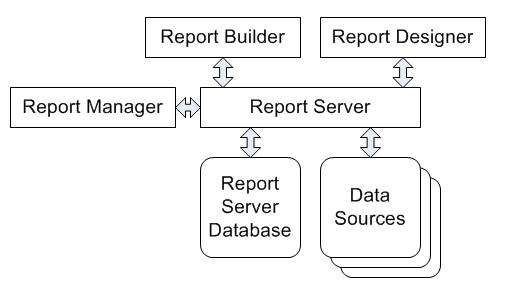
Figure 17-1: Report Server architecture
In this chapter you'll learn about these components:
- Report Server is the core engine that drives Reporting Services.
- Report Manager is a Web-based administrative interface for Reporting Services.
- Report Designer is a developer tool for building complex reports.
- Report Builder is a simplified end-user tool for building reports.
- The Report Server database stores report definitions. Reports themselves can make use of data from many different data sources.
SSRS 2008 Tutorial: Using Report Designer
Reporting Services includes two tools for creating reports:
- Report Designer can create reports of any complexity that Reporting Services supports, but requires you to understand the structure of your data and to be able to navigate the Visual Studio user interface.
- Report Builder provides a simpler user interface for creating ad hoc reports, directed primarily at business users rather than developers. Report Builder requires a developer or administrator to set up a data model before end users can create reports.
We'll start our tour of Reporting Services with Report Designer. Report Designer runs inside the Business Intelligence Development Studio shell, and offers several ways to create reports. You can either use the Report Wizard to quickly create a report, or you can use a set of design tools to build a report from scratch. You can also use the design tools to modify a report created with the wizard.
Using the Report Wizard
The easiest way to create a report in Report Designer is to use the Report Wizard. Like all wizards, the Report Wizard walks you through the process in step-by-step fashion. You can make the following choices in the wizard:
- The data source to use
- The query to use to retrieve data
- Whether to use a tabular or matrix layout for the report
- How to group the retrieved data
- What visual style to use
- Where to deploy the finished report
Try It!
To create a simple report using the Report Wizard, follow these steps:
- Launch Business Intelligence Development Studio.
- Select File > New >Project.
- Select the Business Intelligence Projects project type.
- Select the Report Server Project Wizard template.
- Name the new report ProductReport1 and pick a convenient location to save it in.
- Click OK.
- Read the first page of the Report Wizard and click Next.
- Name the new data source AdventureWorksDS.
- Click the Edit button.
- Log on to your test server.
- Select the AdventureWorks2008 database.
- Click OK.
- Click the Credentials button.
- Select Use Windows Authentication.
- Click OK.
- Check the Make This a Shared Data Source checkbox. This will make this particular data source available to other Reporting Services applications in the future.
- Click Next.
- Click the Query Builder button.
- If the full query designer interface does not display by default, click the query designer toolbar button at the far left end of the toolbar. Figure 17-2 shows the full query designer interface.
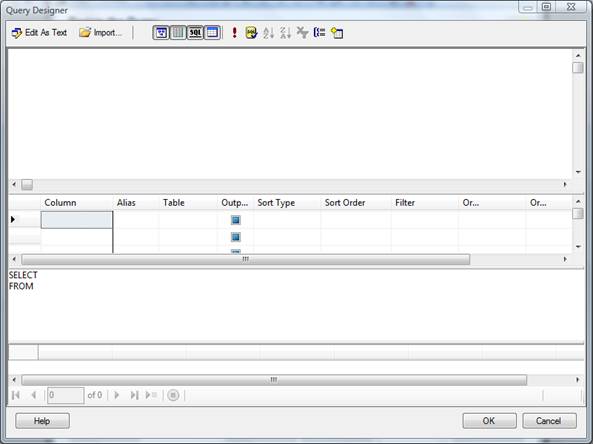
Figure 17-2: Query Builder
- Click the Add Table toolbar button.
- Select the Product table and click Add.
- Click Close.
- Check the Name, ProductNumber, Color, and ListPrice columns.
- Click OK.
- Click Next.
- Select the Tabular layout and click Next.
- Move the Color column to the Group area, and the other three columns to the Detail area, as shown in Figure 17-3.
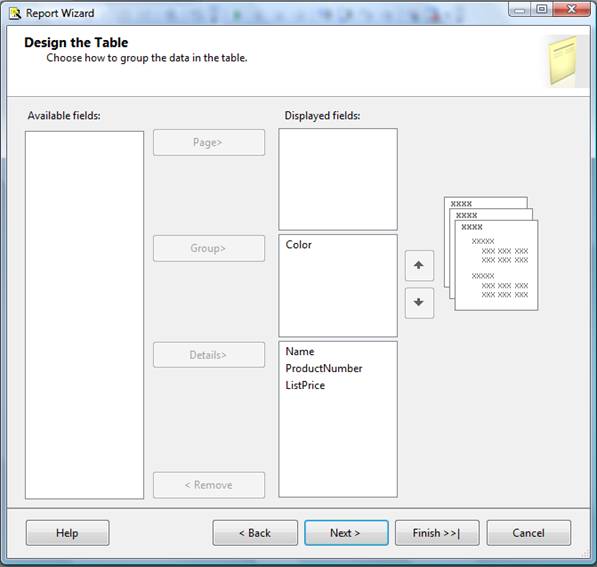
Figure17-3: Grouping columns in the report
- Click Next.
- Select the Stepped layout and click Next.
- Select the Ocean style and click Next.
- Accept the default deployment location and click Next.
- Name the report ProductReport1.
- Check the Preview Report checkbox.
- Click Finish.
Figure 17-4 shows the finished report, open in Report Designer.
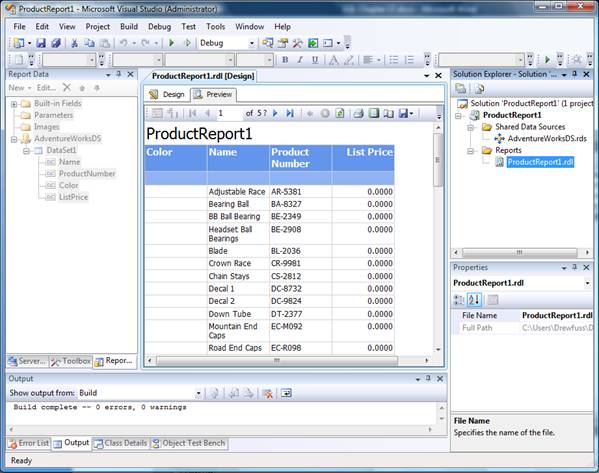
Figure 17-4: Report created by the Report Wizard
Figure 17-4 shows the main features of Report Designer:
- The Datasets window shows the data that is available to the report.
- The main design window lets you view the report itself. You can see a preview of the report, work with the report in a layout designer, or work with the query that returns the data for the report.
- The Solution Explorer, Output, and Properties windows are the standard Visual Studio windows.
Modifying a Report
Now that you've created a report with the Report Wizard, you can modify it with the Report Designer. If you've used any sort of visual report design tool in the past, you should have no problem making changes here. Among the possibilities here:
- You can change the available data or the sort order for the report by modifying the query on the Data tab.
- You can resize or rearrange controls on the Layout tab.
- You can use the Properties window to change properties of individual controls including their font, alignment, colors, and so on.
Try It!
To modify the report that you just created, follow these steps:
- Click the Design tab to make the report editable.
- In the Report Data window, right-click on DataSet1 and select Dataset Properties.
- In the Dataset Properties window, click the Query Designer button.
- Select a Descending sort type for the ListPrice column and click OK.
- Click OK.
- Click in the textbox at the top of the report, where the report name is displayed.
- Click a second time in the textbox to put it in edit mode and change the value of this control to Products By Color.
- Click on the header for the Product column.
- Place the cursor between the column selectors above the Name and Product Number columns to display a double-headed arrow. Hold down the mouse button and drag the cursor to the right to widen the Name column.
- Place the cursor between the column selectors above the Product Number and ListPrice columns to display a double-headed arrow. Hold down the mouse button and drag the cursor to the right to widen the Product Number column.
- Click on the Preview tab to view the modified report, as shown in Figure 17-5.
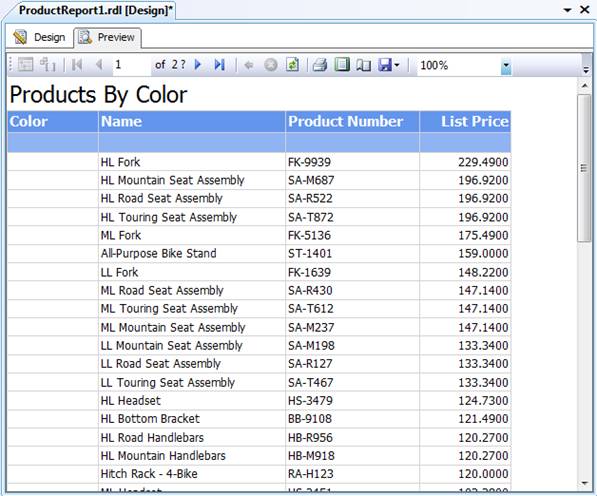
Figure 17-5: Modified product report
Designing a Report From Scratch
You can also use Report Designer to build your own reports starting from scratch. In general, you'll follow these steps to create a report:
- Create a Report project in Business Intelligence Design Studio or open an existing Report project.
- Add a report to the project.
- Create one or more datasets for the report.
- Build the report layout.
Try It!
To create a fresh report in Report Designer, follow these steps:
- Select File > New > Project.
- Select the Business Intelligence Projects project type.
- Select the Report Server Project template.
- Name the new report ProductReport2 and pick a convenient location to save it in.
- Right-click on the Reports node in Solution Explorer and select Add > New Item.
- Select the Report template.
- Name the new report ProductReport2.rdl and click Add.
- In the Report Data window, select New > Data Source.
- Name the new Data Source AdventureWorksDS.
- Select the Embedded Connection option and click on the Edit button.
- Connect to your test server and choose the AdventureWorks2008 database.
- Click OK.
- Click OK again to create the data source.
- In the Report Data window, select New > Dataset.
- Name the dataset dsLocation.
- Click the Query Designer button.
- If the full Query Designer does not appear, click on the Edit As Text button.
- Click the Add Table button.
- Select the Location table.
- Click Add.
- Click Close.
- Check the boxes for the Name and CostRate columns.
- Sort the dataset in ascending order by Name and click OK.
- Click OK again to create the dataset.
- Open the toolbox window (View > Toolbox).
- Double-click the Table control.
- Switch back to the Report Data window.
- Expand the dataset to show the column names.
- Drag the Name field and drop it in the first column of the table control on the design tab.
- Drag the CostRate field from the Report Data window and drop it in the second column of the table control.
- Place the cursor between the column selectors above the Name and CostRate columns to display a double-headed arrow. Hold down the mouse button and drag the cursor to the right to widen the Name column.
- Figure 17-6 shows the report in Design view.
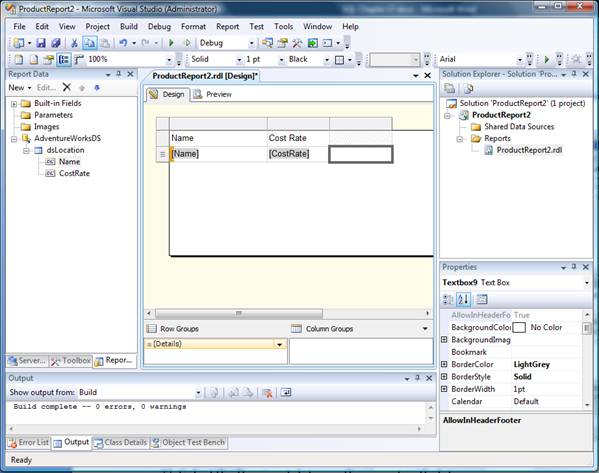
Figure 17-6: Designing a report from scratch
-
Select the Preview tab to see the report with data.
SSRS 2008 Tutorial: Publishing a Report
Creating reports in Business Intelligence Development Studio is good for developers, but it doesn't help users at all. In order for the reports you build to be available to others, you must publish them to your Reporting Services server. To publish a report, you can use the Build and Deploy menu items in Business Intelligence Development Studio. Before you do this, you need to check the project's configuration to make sure that you've selected an appropriate server for the deployment.
Try It!
You can publish any report, but the first report you created is probably more visually interesting at this point. To publish the first report, follow these steps:
- Select File > Recent Projects and choose your ProductReport1 project.
- Select Project „ ProductReport1 Properties.
- Click the Configuration Manager button.
- Fill in the Target Server URL for your Report Server. If you're developing on the same computer where Reporting Services is installed, and you installed in the default configuration, this will be http://localhost/ReportServer. Figure 17-7 shows the completed Property Pages.
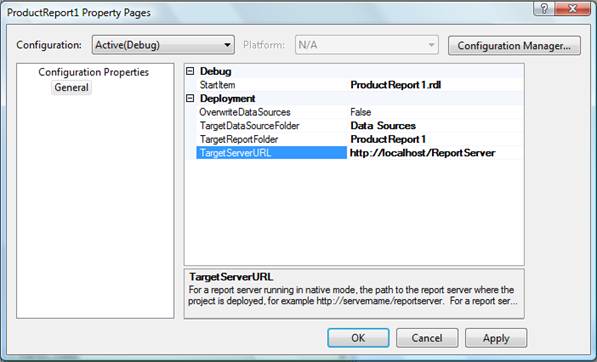
Figure 17-7: Setting the active configuration
- Click OK.
- Select Build > Deploy ProductReport1. The Output Window will track the progress of BIDS in deploying your report, as shown in Figure 17-8. Depending on the speed of your computer, building the report may take some time.
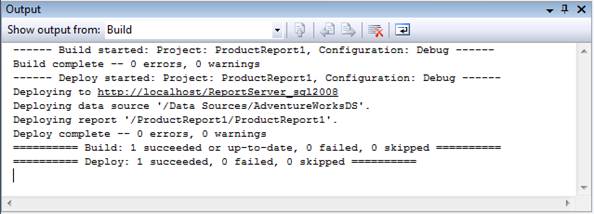
Figure 17-8: Setting report project properties
- Launch a web browser and enter the address http://localhost/reports.
- It may take several minutes for the web page to display; Reporting Services goes to sleep when it hasn't been used for a while and can take a while to spin up to speed. Figure 17-9 shows the result.
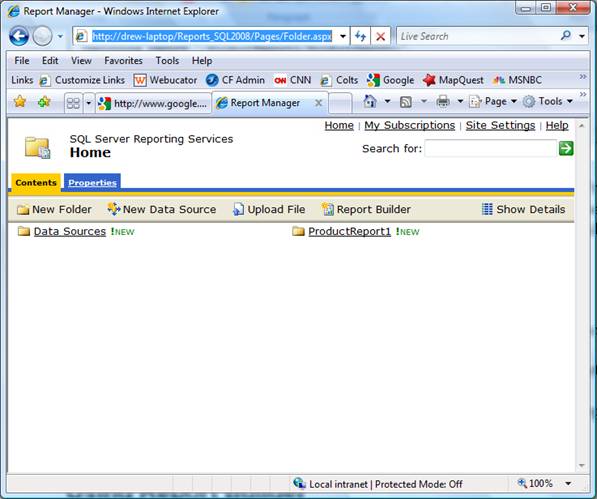
Figure 17-9: Deploying a report
- Click the link for the ProductReport1 folder.
- Click the link for the ProductReport1 report.
SSRS 2008 Tutorial: Using Report Builder
Report Designer gives you one way to create reports for Reporting Services, but it's not the only way. SQL Server 2008 also includes a tool directed at end users named Report Builder. Unlike Report Designer, which is aimed at Developers, Report Builder presents a simplified view of the report-building process and is intended for business analysts and other end users.
Building a Data Model
Report Builder doesn't let end users explore all of a SQL Server database. Instead, it depends on a data model: a preselected group of tables and relationships that a developer has identified as suitable for end-user reporting. To build a data model, you use Business Intelligence Development Studio. Data models contain three things:
- Data Sources connect the data model to actual data.
- Data Source Views draw data from data sources.
- Report Models contain entities that end users can use on reports.
Try It!
To create a data model, follow these steps:
- If it's not already open, launch Business Intelligence Development Studio
- Select File > New > Project.
- Select the Business Intelligence Projects project type.
- Select the Report Model Project template.
- Name the new project AWSales and save it in a convenient location.
- Click OK.
- Right-click on Data Sources in Solution Explorer and select Add New Data Source.
- Read the first page of the Add New Data Source Wizard and click Next.
- Click New.
- In the Connection Manager dialog box connect to the AdventureWorks2008 database on your test server and click OK.
- Click Next.
- Name the new data source AdventureWorks and click Finish.
- Right-click on Data Source Views in Solution Explorer and select Add New Data Source View.
- Read the first page of the Add New Data Source View Wizard and click Next.
- Select the AdventureWorks data source and click Next.
- Select the Product(Production) table and click the > button to move it to the Included Objects listbox.
- Select the SalesOrderDetail(Sales) table and click the > button to move it to the Included Objects listbox.
- Click the Add Related Tables button.
- Click Next.
- Click Finish.
- Right-click on Report Models in Solution Explorer and select Add New Report Model.
- Read the first page of the Report Model Wizard and click Next.
- Select the Adventure Works2008 data source view and click Next.
- Keep the default rules selection, as shown in Figure 17-10, and click Next.
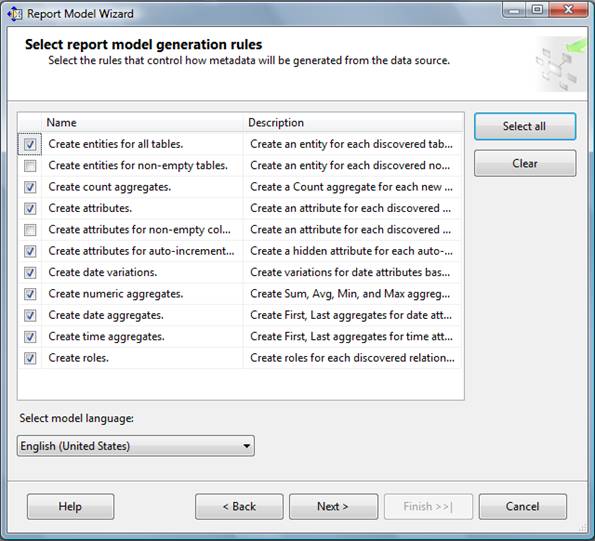
Figure 17-10: Creating entities for end-user reporting
- Choose the Update Statistics option and click Next.
- Click Run to complete the wizard.
- Click Finish. If you get a warning that a file was modified outside the source editor, click Yes.
- Select Build > Deploy AWSales to deploy the report model to the local Reporting Services server.
Building a Report
Report Builder itself is a ClickOnce Windows Forms application. That means that it's a Windows application that end users launch from their web browser, but it never gets installed on their computer, so they don't need any local administrator rights on their computer to run it. To get started with Report Builder, browse to your Reporting Services home page. Typically, this will have a URL such as http://ServerName/Reports (or http://localhost/Reports if you're running the browser on the same box with SQL Server 2008 itself). Figure 17-11 shows the Reporting Services home page.
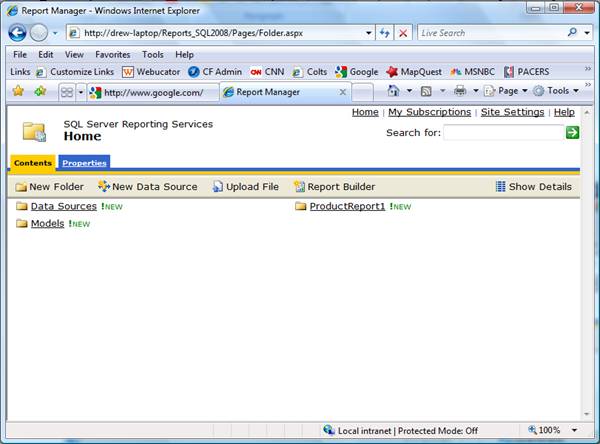
Figure 17-11: Reporting Services home page
To run Report Builder, click the Report Builder link in the home page menu bar. Report Builder will automatically load up all of the available report models and wait for you to choose one to build a report from.
Try It!
- Open a browser window and navigate to http://localhost/Reports (or to the appropriate Report Server URL if you're not working on the report server).
- Click the Report Builder link.
- Depending on your operating system, you may have to confirm that you want to run the application.
- After Report Builder is loaded, select the AdventureWorks2008 report model and the table report layout. Click OK. Figure 17-12 shows the new blank report that Report Builder will create.
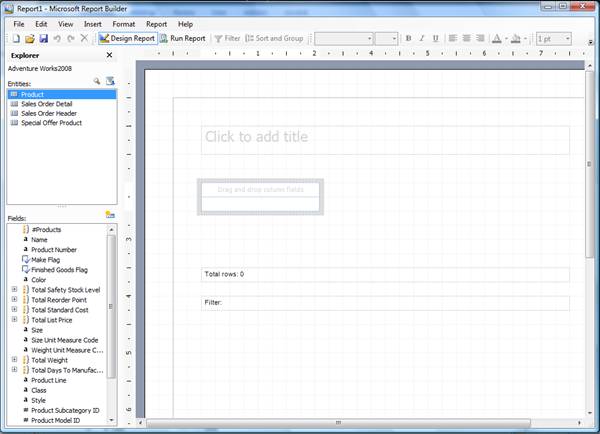
Figure 18-12: New report in Report Builder
The Explorer window to the left of the design surface shows all of the tables in the report model. Beneath that, the Fields window shows the attributes in the currently-selected entity. Note that not everything in this window is a column in the table: the report model also contains aggregate entities such as Total Safety Stock Level and automatically calculated fields. |
- Select the Product table.
- Drag the Name field and drop it in the area labeled Drag and Drop Column Fields.
- Click on Special Offer Products in the Explorer window to show related child tables.
- Click on Sales Order Details.
- Drag the Total Order Qty field and drop it to the right of the Name field.
- Click where it says Click to Add Title and type Product Sales.
- Click the Run Report button to produce the report shown in Figure 17-13.
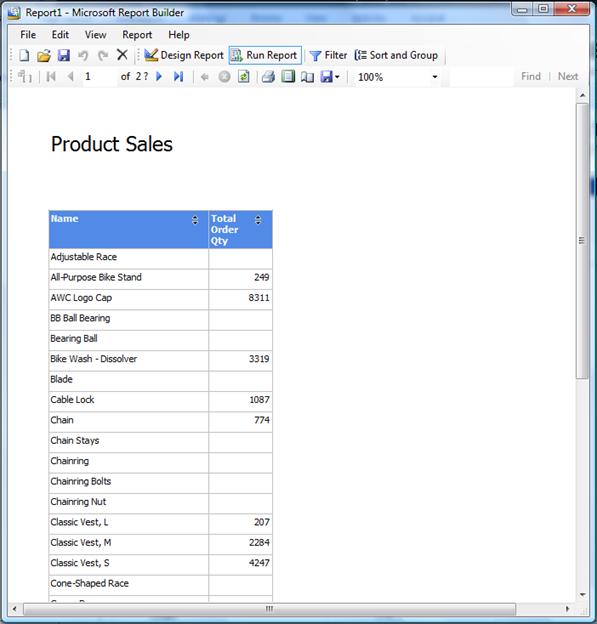
Figure 17-13: Report in Report Builder
- Click the Sort and Group toolbar button.
- Select to sort by Total Order Qty descending.
- Click OK.
- Select File > Save.
- Name the new report Product Sales.
- Click Save. This will publish the report back to the Reporting Services server that you originally downloaded Report Builder from.
SSRS 2008 Tutorial: Using Report Manager
The Web home page for Reporting Services provides a complete interface for managing reports (as well as other objects such as data sources and models) after they are created. This interface, known as Report Manager, is intended primarily for database administrators, but as a developer you should know about its capabilities for managing and modifying reports.
When you click on a report in Report Manager, you'll see the report's data, as shown in Figure 17-14.
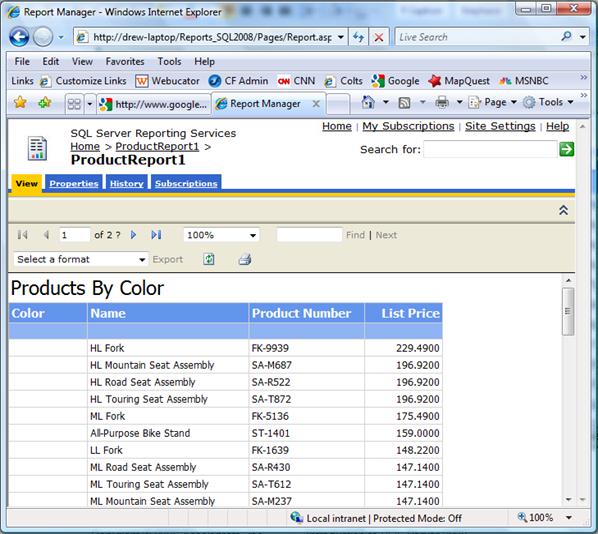
Figure 17-14: Report in Report Manager
Note that reports in Report Manager open in a tabbed interface. The four tabs allow you to perform various functions:
- View allows you to see the current data in the report.
- Properties lets you adjust such things as the report's name, data source, security credentials, caching, and end-user security.
- History shows you saved snapshots of the report.
- Subscriptions lets you create subscriptions to the report. Subscriptions allow you to set up periodic delivery of reports to end users by e-mail or file share.
Printing and Exporting Reports
When viewing reports in the Report Manager, users can print the reports directly from their browser. The print button in the report toolbar utilizes an ActiveX control for client-side printing. The first time this button is clicked on a given computer, the user is prompted to install the ActiveX control, as in Figure 17-15. After that, the standard Windows print dialog box is displayed for the user to select a printer and paper size, etc.
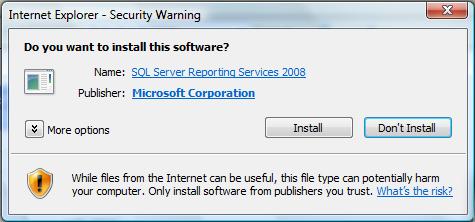
Figure 17-15: ActiveX install prompt.
Users can also export the report into any of several handy formats. Table 17-1 lists the available export formats.
| Export Format |
Handles |
| XML |
Creates a data file in XML format./td>
|
| CSV |
Creates a comma-delimited text file of report data. |
| PDF |
Creates an Adobe Acrobat file with the formatted report. |
| MHTML |
Creates a Web Archive file with the formatted report. |
| EXCEL |
Creates a MS Excel spreadsheet with the formatted report. |
| TIFF |
Creates a TIFF graphic of the formatted report. |
| Word |
Creates a MS Word document with the formatted report. |
Table 17-1: Export Formats
SSRS 2008 Tutorial: Exercises
Use Report Builder to create a report from the AdventureWorks2008 data model showing the minimum and maximum order quantity for orders taken by each salesperson in the company. You'll find the necessary data in the SalesOrderHeader and SalesOrderDetail tables.
Solutions to Exercises
- Open a browser window and navigate to http://localhost/Reports (or to the appropriate Report Server URL if you're not working on the report server).
- Click the Report Builder link.
- Select the AdventureWorks2008 report model and the table report layout.
- Click OK.
- Select the Sales Order Header table.
- Drag the Sales Person ID field and drop it in the area labeled Drag and Drop Column Fields.
- Click on Sales Order Details in the Explorer window.
- Expand the Total Order Qty field in the Fields window to show the alternative fields beneath it.
- Drag the Min Order Qty field and drop it to the right of the Name field.
- Drag the Max Order Qty field and drop it to the right of the Min Order Qty field.
- Click where it says Click to Add Title and type Sales Performance.
- Click the Run Report button to produce the report shown in Figure 17-15.
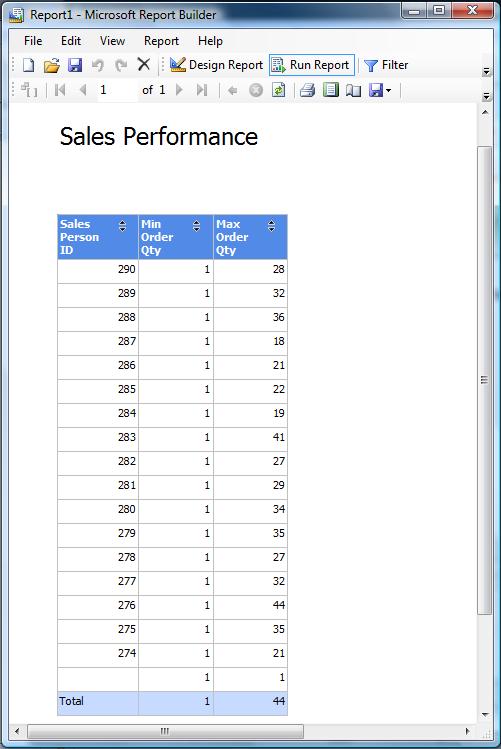
Figure 17-15: Sales performance report
In-Depth SQL Server Training
For in-depth SQL Server training, click here to view all of Accelebrate's SQL Server training courses for you and your staff.
Request Pricing |

